Wednesday, October 14, 2015

Measuring Customer Loyalty using Dynamics CRM

I recently received an invitation from my mobile phone company to participate in a survey by responding to five simple questions by text message.

The first question:
How likely are you to recommend Company X to your friends and colleagues? Reply with a number between 1 and 10 where 10 is ‘Extremely Likely’
This question is used as part of the tool called Net Promoter Score which is a customer loyalty metric developed by Bain Company consultant Fred Reichheld. Customers who choose a score of 9 or 10 are labeled promoters. Those who choose a score of 1 to 6 are categorized detractors, while those who select 7 or 8 are deemed passively satisfied. The net promoter score (NPS) measures the difference between the percentages of customers who are promoters and detractors. For example, if 60% of your customers are promoters and 20% are detractors, your net promoter score is 40. An NPS that is positive (i.e., higher than zero) is considered to be good, and an NPS of +50 is considered excellent. Reichheld’s research suggests that changes in a company’s net promoter score correlate with changes in its revenues i.e. increasing NPS is a leading indicator of positive revenue growth. In other words, it can be used to predict positive revenue growth.
There are several survey tools that work with Dynamics CRM including Mojo Surveys and ClickDimensions. Once you have your survey responses collected, you can present this information in a graphical format for easy access by your sales, marketing and service teams.
I used the following steps to accomplish this.
  1. Create two custom entities
    1. Customer Loyalty Survey: This entity contains the following fields.
      1. Name
      2. Survey Date
      3. Total Responses (integer)
      4. Total Promoters (integer)
      5. Total Detractors (integer)
      6. Net Promoter Score (decimal, may be positive or negative, between -100 and 100)
    2. Customer Loyalty Survey Response: This entity contains the following fields.
      1. Name
      2. Customer Loyalty Survey (lookup to the above entity)
      3. Response (integer between 1 and 10)
      4. Comments (if any)


  1. Create a Workflow to summarize survey results
    1. Trigger: When Customer Loyalty Survey Response is created
    2. Step: Calculate and update Total Responses, Total Promoters, Total Detractors and Net Promoter Score
      Note: Net Promoter Score = (Total Promoters – Total Detractors) / Total Responses


  1. Create a chart to display Net Promoter Score by Survey
After you import survey responses into Customer Loyalty Survey Response entity, the results including NPS are automatically calculated by the workflow created above. The results are then available for viewing as view and chart similar to a screenshot below.


NPS can be incorporated as a Key Performance Indicator (KPI) in a dashboard or a balanced scorecard for your sales, marketing and service teams.

Sunday, September 13, 2015

Leverage “Quick Find” for “Quick Data Entry”

As the name of the feature suggests, users of Dynamics CRM can use “Quick Find” to quickly and easily search for the records in the entity. You can configure the Quick Find view for a specific entity by defining “view” columns and “find” columns. CRM searches for the text you enter in the search box (including any wild cards) in the “find” columns defined for the Quick Find view.
In addition to this functionality, you can also use this feature for quick data entry. The following example illustrates this.
In this example, the company uses CRM to provide services to publicly traded companies. Companies are stored in the Account entity. Each company has been populated with its unique Ticker Symbol. Account Quick Find view has been configured with Ticker Symbol as one of the “Find” columns. The following screenshot shows the sample company data.


With the Ticker Symbol defined as one of the “Find” columns for the Quick Find view, you can now enter the unique Ticker Symbol anywhere in CRM where you need to enter the Company name. This includes Advanced Find and forms where the Account (lookup) needs to be entered.
For example, when you enter “MSFT” in the Account (lookup) field in the Opportunity form and tab out, CRM populates “Microsoft Corporation” in the field.


Because Ticker Symbols are unique across the companies, CRM finds exactly one record based on the Ticker Symbol you enter. This technique can also be used for the other unique fields such as Account Number, Short Name or Alias.

Saturday, September 12, 2015

Sending Direct Email and Automated Email to records in a custom entity in Dynamics CRM

Prior to Dynamics CRM 2013, you could not send direct email to records in a custom entity as you could for the standard entities such as Account, Contact, Lead and User.
With the introduction of the following option on the entity configuration when you create a custom entity, you can now enable the entity for sending Direct Email.


Selecting this option (as in the above screenshot), adds the Send Direct Email button to the main ribbon tab for the entity.
For example, I have a custom entity named Workorder with the “Sending email” option checked. When I select the records in the Workorders view, I see the “SEND DIRECT EMAIL” button on the ribbon which enables me to send direct email for the selected records. Using this feature, a user can send direct email to the email address on the selected records.

If you do not have an existing email address field in the entity, CRM creates one as seen in the screenshot below.

Note that after you enable this option, it cannot be disabled.
Another not so obvious and undocumented feature that becomes available when you select this option is an ability to send email to the email address on the record using a Workflow.
Prior to CRM 2013, in order to send email to the Email address on the custom entity records, you had to select the “Allow messages with unresolved email recipients to be sent” option in System Settings (shown below). You could then populate the “To” field in the email with the Email address on the custom entity record in a custom workflow activity which requires custom development.

With the “Sending email” option, you can do this without enabling the above system setting. This can now be accomplished using a standard Workflow as illustrated in the screenshot below.

Sunday, September 6, 2015

Upgrade PowerPivot Data Model to SSAS Tabular

In the previous articles, I discussed the steps for building PowerPivot data models for Dynamics GP Sales and Financial (GL) data using PowerPivot for Excel. This is a great way for power users to build powerful business intelligence solutions without expensive hardware and difficult to use development tools. It is also a great way for professional BI developers to prototype a complete solution quickly.

However, there will be situations where PowerPivot based solutions may not meet your business needs. In this case, there are two upgrade paths available to migrate your PowerPivot data model. These are PowerPivot for SharePoint and SSAS Tabular. In this article, I will discuss SSAS Tabular.
Here are some of the reasons why you may want to upgrade from PowerPivot to SSAS Tabular.
Security
Tabular model databases can use row-level security, using role-based permissions in Analysis Services. For example, you can configure security to enable Sales Manager to view all sales data while Salesperson to view only his or her sales data.
Power Pivot workbooks are secured at the file level. A user who has access to the file can view all the information contained within the workbook.
Scalability
PowerPivot for Excel has an artificial file size limit of 2 gigabytes, which is imposed so that workbooks created in Power Pivot for Excel can be uploaded to SharePoint, which sets maximum limits on file upload size. One of the main reasons for migrating a Power Pivot workbook to a tabular solution on a standalone Analysis Services instance is to get around the file size limitation.
Partitioning
Partitions, in tabular models, divide a table into logical partition objects. Each partition can then be processed independent of other partitions. For example, a table may include certain row sets that contain data that rarely changes (historical sales data, for example), but other row sets have data that changes often (current year’s sales data).
Query and Reporting
Excel and PowerView are your only options if you use PowerPivot. With SSAS Tabular, you can use many other reporting tools including SQL Server Reporting Services (SSRS).
You will find detailed comparison of SSAS Tabular and PowerPivot here.
Before you upgrade your PowerPivot data model to SSAS Tabular, you will need the following:
  1. SQL Server Analysis Services instance running in Tabular mode (I used SQL Server 2014)
  2. SQL Server Data Tools (SSDT) (This is required if you use Visual Studio to import your data model to SSAS Tabular. Please see below for details)
There are two ways you can import your PowerPivot data model to SSAS Tabular.

Option 1:
SQL Server Management Studio option: Import directly to SQL Server using Restore from PowerPivot option as shown in the following screenshot


Option 2:

Visual Studio (SSDT) option: Import using Visual Studio (SSDT) as shown in the following screenshot
Once completed, you will be able to connect to the SSAS Tabular data model on the server and create a report in Excel and other reporting tools such as SSRS.
Here’s the PivotTable created using Excel. You will notice that the presentation of PivotTable fields is slightly different from what you see when you create a PivotTable from PowerPivot data model. For example, KPIs have their own folder. However, the end result is the same.

Because the data is no longer stored within the Workbook but is stored on the server, the file size is very small as shown in the following screenshot.


After you have migrated the PowerPivot data model to SSAS Tabular, you do not need the original Excel workbook any more. You will need to use Visual Studio to make changes to the Tabular data model and implement new features such as security and partitioning.

If you would like to learn more about SSAS Tabular, you will find step by step tutorials here.

Saturday, August 22, 2015

Storing and Querying Age in Dynamics CRM

In the previous post, I discussed how we can use North52 Formula Manager to calculate age in Dynamics CRM.

In a recent implementation, we needed to store a running age of each contact in years and months in CRM. Users also needed an ability to query contacts based on the age including an ability to search contacts using the age range. For example, find all contacts with ages between 1 year and 9 months and 2 years and 9 months. Of course, they wanted to be able to do this intuitively. They wanted to be able to enter 1 year and 9 months using the numbers 1 (year) and 9 (months) rather than 1.75 because this would require users to calculate the fraction in their head before doing the search. Also, some of the fractions would be difficult to calculate mentally. For example, 7 months would be equal to 0.583333 (years).
We cannot store the age value in two different fields i.e. years and months because this would prevent users from using ranges i.e. > and < operators in the Advanced Find query or in the System View.
For example, the following query will return incorrect results:
Age_Years >= 1 AND
Age_Months >= 9 AND
Age_Years <= 2 AND
Age_Months <= 9
We addressed this problem by storing the age values as a decimal number with 2 decimals. The whole number represents years and the fraction represents months. For example, 1 year and 1 month is stored as 1.01, 1 year and 10 months is stored as 1.10 and 2 years is stored as 2.00. This is both intuitive to the users in terms of how they think (in years and months rather than fractions) and also enables users to create Advanced Find queries and views based on the age range. Now, they can easily use the following filter criteria to query all contacts between the ages of 1 year and 9 months and 2 years and 9 months:
Age >= 1.09 AND
Age <= 2.09

Sunday, April 5, 2015

Calculate Age in Dynamics CRM

There are situations when there is a need to calculate the elapsed time between the two dates within Dynamics CRM. Here are a few scenarios where this calculation may be needed:
  • Calculate child’s age to determine the lesson plan for the child
  • Calculate number of days the invoice is outstanding
  • Calculate number of days the opportunity is in the current stage
At this time, Dynamics CRM does not have a feature to calculate the difference between two dates out of the box. Calculated fields feature in CRM 2015 does not support this calculation at this time. 

Note: Please see the comment below for an update for Dynamics CRM 2015 Online Update 1.

However, you can accomplish this using an ISV solution from North52.

Depending on your needs, you can use one of the following approaches for age calculation.

Display Age on Contact form
If you need to simply display age of a specific contact on the Contact form, you can create a North52 formula and display the result in HTML web resource placed on the form. You will find step by step instructions here.
Calculate Days in Stage
There are situations where user not only needs to see this calculation for a specific record on the form but also on the views and charts and use the result in the filter criteria for searching. In this case, the result needs to be calculated and stored in a field in CRM. You will need to create a field in CRM and use North52 Process Genie and Scheduler to update it. Step by step instructions can be found here.
In addition to the above two methods, if you have a large volume of records that needs to be updated daily, you can create a SQL job to update the field each day. However, note that direct update to the database (as in this approach) is not supported.

Please also see the related article Storing and Querying Age in Dynamics CRM.

Saturday, January 10, 2015

Lead Scoring using SQL Server Analysis Services and Excel

Sales and Marketing departments at many companies use lead scoring to determine sales readiness of leads. At a high level, lead scoring involves the following steps:

  • Identify key factors that influence customer’s purchasing decision
  • Determine relative impact of each factor on the purchasing decision
  • Formulate lead scoring rules using the above information
  • Determine a score threshold required for a lead to be identified as sales ready
Key factors that may influence a lead’s purchasing decision depend on the product or service being offered and may include any of the following:
  • Demographic attributes such as gender, marital status, home ownership, income, number of children, location, etc.
  • Online behavior such as web inquiries, number of visits to a web page, clicks in response to an email campaign, etc.
  • Lead source including search engine, marketing campaign, trade show, etc.
Leads above the pre-determined lead score threshold are converted into qualified opportunities and pursued further. Also, depending on the score, a lead may be assigned to appropriate sales resources. For example leads with the score above 500 may be assigned to a senior salesperson whereas leads with the score between 200 and 300 may be assigned to telemarketing. Leads between the score of 100 and 200 may be included in a nurture campaign.
Often, sales and marketing departments collaborate to develop a lead scoring model based on their past experience with customers’ purchasing behavior and industry knowledge.
If you have sufficient historical data related to past wins and losses and customers’ demographics, lead source and online behavior, you can mine this data to determine scoring rules and score threshold.
Microsoft offers an Excel based toolset called Table Analysis Tools for Excel which includes Prediction Calculator.
To use the Table Analysis Tools for Excel, you must first create a connection to an instance of Analysis Services installed in Multidimensional server mode. This connection gives you access to the Microsoft data mining algorithms that are used to analyze your data. (Note: The tools will not work with Tabular server mode).

The following screenshots illustrate the sample input data included with the toolset and the output produced by the Prediction Calculator. 
Sample Input Data:


The table in the screenshot above includes demographic data of bike buyers and whether they purchased a bike or not (last column).
Based on this data, the tool produces the following report.

The suggested threshold to maximize profit is based on the numbers you input for:
False Positive Cost: Cost incurred on marketing, sales and other activities on a lead when the positive prediction by the model is wrong i.e. opportunity is lost.
False Negative Cost: Cost of missed opportunity when the negative prediction by the model is wrong.
True Positive Profit: Profit from correctly predicting a positive result i.e. opportunity is won.
True Negative Profit: Profit (or cost saving) from correctly predicting a negative result.
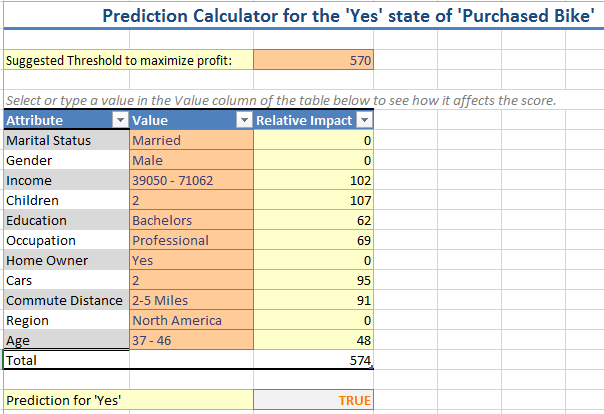
The Score Breakdown shows the list of influencing factors with their relative impact. For example, a relative weight of 47 is used if a prospective buyer is single and 0 if married. You can use these weights to create a scoring formula. The tool provides a worksheet to calculate the score based on the input for each factor and the prediction (win or loss).
If you capture the lead data for influencing factors in Microsoft Dynamics CRM, you can configure a workflow to automatically calculate a lead score based on this data and take appropriate actions such as qualifying a lead, assigning it to an appropriate user or team, sending follow up emails and setting up follow up tasks or phone call activities.