Showing posts with label Power Pivot. Show all posts

Tuesday, June 25, 2024

Creating Free Form Reports using Cube functions in Excel - Follow Up

Back in 2007(!), I wrote a post on creating free form reports using Cube functions in Excel. I noticed that this is still being viewed by some readers. However, the screenshot in the article is missing and I am not able to find the original screenshot to update the post.

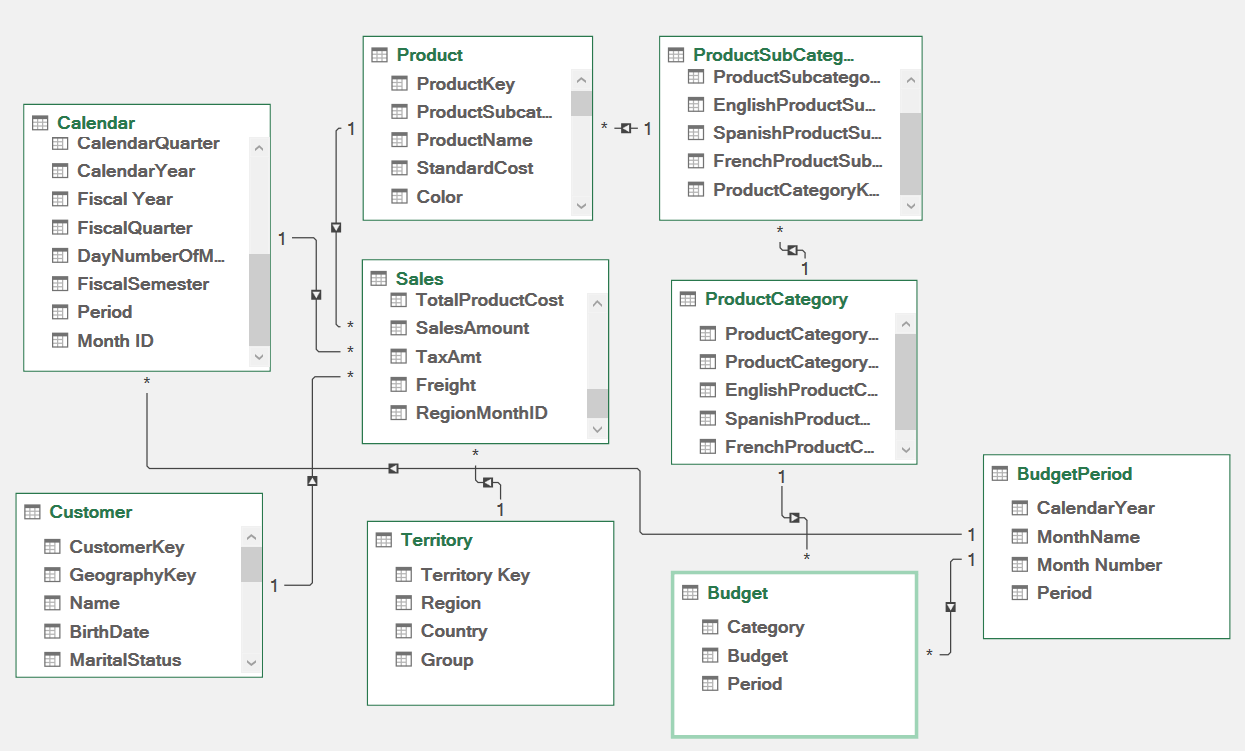
Although I do not have access to the original AdventureWorks cube that I used to create this report, I was able to create a similar report using the following AdventureWorks Excel Power Pivot data model.


As you can see, the sales data is stored in the Sales table and the Budget data is stored in the Budget table. The Sales table contains each transaction at the product level whereas the Budget data is summarized by Category and Period. Also, the Budget table cannot be joined with the Calendar table as 1:N relationship. As such, we will not be able to combine these two tables in a Pivot Table report for comparison purposes (Budget vs Actual).


Therefore, I used the following steps to create a free form report that contains data from both tables and added columns to calculate the variance and variance %.


  1. Created a pivot table from the Sales table.

  2. Created a pivot table from the Budget table.

  3. Converted both pivot tables to convert Pivot Table to Formulas (OLAP Tools > Convert to Formulas).

  4. Created a combined report by copying and pasting formulas from the above two reports.

  5. Added Variance and Variance % columns.


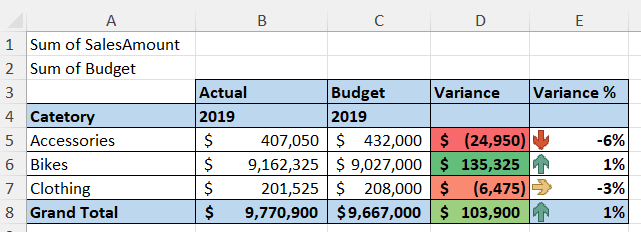
Here’s the resulting free form report.


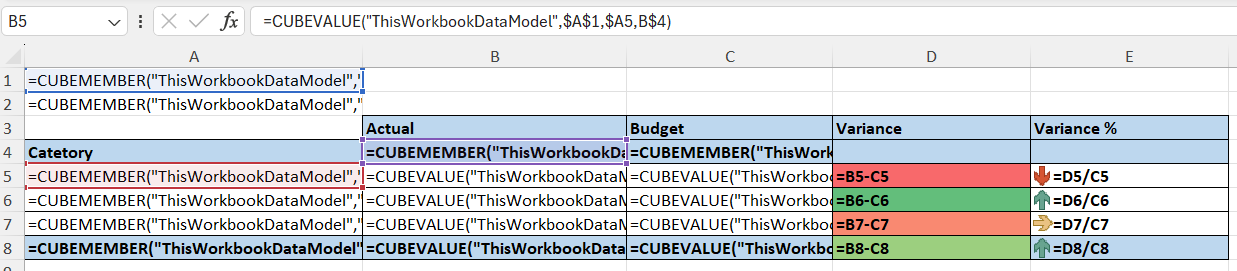
Here’s the report showing underlying formulas.


The report uses the following two Cube functions:


CUBEMEMBER

CUBEVALUE


You can get more details on creating free form reports using Cube functions from the original post here.


Sunday, September 6, 2015

Upgrade PowerPivot Data Model to SSAS Tabular

In the previous articles, I discussed the steps for building PowerPivot data models for Dynamics GP Sales and Financial (GL) data using PowerPivot for Excel. This is a great way for power users to build powerful business intelligence solutions without expensive hardware and difficult to use development tools. It is also a great way for professional BI developers to prototype a complete solution quickly.

However, there will be situations where PowerPivot based solutions may not meet your business needs. In this case, there are two upgrade paths available to migrate your PowerPivot data model. These are PowerPivot for SharePoint and SSAS Tabular. In this article, I will discuss SSAS Tabular.
Here are some of the reasons why you may want to upgrade from PowerPivot to SSAS Tabular.
Security
Tabular model databases can use row-level security, using role-based permissions in Analysis Services. For example, you can configure security to enable Sales Manager to view all sales data while Salesperson to view only his or her sales data.
Power Pivot workbooks are secured at the file level. A user who has access to the file can view all the information contained within the workbook.
Scalability
PowerPivot for Excel has an artificial file size limit of 2 gigabytes, which is imposed so that workbooks created in Power Pivot for Excel can be uploaded to SharePoint, which sets maximum limits on file upload size. One of the main reasons for migrating a Power Pivot workbook to a tabular solution on a standalone Analysis Services instance is to get around the file size limitation.
Partitioning
Partitions, in tabular models, divide a table into logical partition objects. Each partition can then be processed independent of other partitions. For example, a table may include certain row sets that contain data that rarely changes (historical sales data, for example), but other row sets have data that changes often (current year’s sales data).
Query and Reporting
Excel and PowerView are your only options if you use PowerPivot. With SSAS Tabular, you can use many other reporting tools including SQL Server Reporting Services (SSRS).
You will find detailed comparison of SSAS Tabular and PowerPivot here.
Before you upgrade your PowerPivot data model to SSAS Tabular, you will need the following:
  1. SQL Server Analysis Services instance running in Tabular mode (I used SQL Server 2014)
  2. SQL Server Data Tools (SSDT) (This is required if you use Visual Studio to import your data model to SSAS Tabular. Please see below for details)
There are two ways you can import your PowerPivot data model to SSAS Tabular.

Option 1:
SQL Server Management Studio option: Import directly to SQL Server using Restore from PowerPivot option as shown in the following screenshot


Option 2:

Visual Studio (SSDT) option: Import using Visual Studio (SSDT) as shown in the following screenshot
Once completed, you will be able to connect to the SSAS Tabular data model on the server and create a report in Excel and other reporting tools such as SSRS.
Here’s the PivotTable created using Excel. You will notice that the presentation of PivotTable fields is slightly different from what you see when you create a PivotTable from PowerPivot data model. For example, KPIs have their own folder. However, the end result is the same.

Because the data is no longer stored within the Workbook but is stored on the server, the file size is very small as shown in the following screenshot.


After you have migrated the PowerPivot data model to SSAS Tabular, you do not need the original Excel workbook any more. You will need to use Visual Studio to make changes to the Tabular data model and implement new features such as security and partitioning.

If you would like to learn more about SSAS Tabular, you will find step by step tutorials here.

Saturday, December 13, 2014

Build PowerPivot Data Model for Financial Analysis in Dynamics GP

In the previous article, I described the steps to build a PowerPivot data model to analyze Microsoft Dynamics GP Sales data. In this article, I will explain the steps I used to build a data model that can be used for financial analysis using General Ledger data in Dynamics GP. (See the related article Upgrade PowerPivot Data Model to SSAS Tabular).
The following screenshot shows the final PowerPivot data model in the diagram view.


The first steps in building this data model is to retrieve opening and closing balances and net change for each account and period in General Ledger. The query to retrieve this data can be found in the article SQL to Create GL Account Balances Table for Dynamics GP. The other tables include Accounts, Calendar and Period. The Calendar and Period tables are explained in the previous article. The Accounts table uses the Accounts view in Dynamics GP database.
Once we have the above tables created, we can create the calculated fields required for financial analysis. First, I created the base fields used in calculating various financial ratios. The following table shows the base fields, DAX formulas and some additional information.
Note that the DAX formulas are specific to the sample company (TWO) Chart of Accounts and Account Categories. You may have to modify these formulas to work with your company’s Chart of Accounts and Account Categories.
Calculated Fields
Calculated Field
DAX Formula
Additional information
ClosingBalance
CALCULATE(SUM([Ending Balance]), LASTDATE(Calendar[Date]))
Closing Balance for the last date based on selected dates
Activity
SUM([Net Change])
Total Net Change based on selected dates
ActivityYTD
[Activity](DATESYTD(Calendar[Date]))
Total YTD Net Change based on selected dates
ActivityQTD
[Activity](DATESQTD(Calendar[Date]))
Total QTD Net Change based on selected dates
ActivityPrevYearQTD
[Activity](DATEADD(DATESQTD(Calendar[Date]),-1,YEAR))
Total QTD Net Change last year based on selected dates
ActivityPrevYearYTD
[Activity](DATEADD(DATESYTD(Calendar[Date]),-1,YEAR))
Total YTD Net Change last year based on selected dates
ActivityPrevYear
[Activity](DATEADD(Calendar[Date],-1,YEAR))
Total Net Change last year based on selected dates
ActivityMTD
[Activity](DATESMTD(Calendar[Date]))
Total MTD Net Change based on selected dates
ActivityPrevYearMTD
[Activity](DATEADD(DATESMTD(Calendar[Date]),-1,YEAR))
Total MTD Net Change last year based on selected dates
PeriodActivity
IF(HASONEVALUE(Period[Period]),
 SWITCH(VALUES(Period[Period]),
 "Current", [Activity],
 "MTD", [Activity](DATESMTD(Calendar[Date])),
 "QTD", [Activity](DATESQTD(Calendar[Date])),
 "YTD", [Activity](DATESYTD(Calendar[Date])),
 "PrevYear", [Activity](DATEADD(Calendar[Date],-1,YEAR)),
 "PrevYearMTD", [Activity](DATEADD(DATESMTD(Calendar[Date]),-1,YEAR)),
 "PrevYearQTD", [Activity](DATEADD(DATESQTD(Calendar[Date]),-1,YEAR)),
 "PrevYearYTD", [Activity](DATEADD(DATESYTD(Calendar[Date]),-1,YEAR)),
 BLANK()))
Total Net Change for selected dates and period (Current, MTD, QTD, etc.). This field can be dragged to the Pivot Table or report along with dates and period to dynamically calculate the Net Change amount.
CurrentAssets
CALCULATE(SUM([Ending Balance]), LASTDATE(AccountBalances[Ending Date]), FILTER('AccountBalances',RELATED('Accounts'[Account Category]) = "Accounts Receivable" ||
    RELATED('Accounts'[Account Category]) = "Cash"||
    RELATED('Accounts'[Account Category]) = "Inventory"||
    RELATED('Accounts'[Account Category]) = "Prepaid Expenses"||
    RELATED('Accounts'[Account Category]) = "Work in Process"||
    RELATED('Accounts'[Account Category]) = "Notes Receivable"||
    RELATED('Accounts'[Account Category]) = "Short-Term Investments"))
Total Current Assets for the last date based on selected dates
CurrentLiabilities
CALCULATE(SUM([Ending Balance]), LASTDATE(AccountBalances[Ending Date]), FILTER('AccountBalances', RELATED('Accounts'[Account Category]) = "Accounts Payable" ||
    RELATED('Accounts'[Account Category]) = "Dividends Payable"||
    RELATED('Accounts'[Account Category]) = "Interest Payable"||
    RELATED('Accounts'[Account Category]) = "Notes Payable"||
    RELATED('Accounts'[Account Category]) = "Other Current Liabilities"||
    RELATED('Accounts'[Account Category]) = "Taxes Payable"))*-1
Total Current Liabilities for the last date based on selected dates
CurrentAssetsBeg
CALCULATE(SUM([Beginning Balance]), FIRSTDATE(AccountBalances[Ending Date]), FILTER('AccountBalances',RELATED('Accounts'[Account Category]) = "Accounts Receivable" ||
    RELATED('Accounts'[Account Category]) = "Cash"||
    RELATED('Accounts'[Account Category]) = "Inventory"||
    RELATED('Accounts'[Account Category]) = "Prepaid Expenses"||
    RELATED('Accounts'[Account Category]) = "Work in Process"||
    RELATED('Accounts'[Account Category]) = "Notes Receivable"||
    RELATED('Accounts'[Account Category]) = "Short-Term Investments"))
Total Current Assets for the first date based on selected dates
AvgCurrentAssets
([CurrentAssetsBeg]+[CurrentAssets])/2
Average of beginning and ending Current Assets based on selected dates
Inventory
CALCULATE(SUM([Ending Balance]), LASTDATE(AccountBalances[Ending Date]), FILTER('AccountBalances',RELATED('Accounts'[Account Category]) = "Inventory"))
Ending Inventory balance based on selected dates
InventoryBeg
CALCULATE(SUM([Beginning Balance]), FIRSTDATE(AccountBalances[Ending Date]), FILTER('AccountBalances',RELATED('Accounts'[Account Category]) = "Inventory"))
Beginning Inventory balance based on selected dates
AvgInventory
([InventoryBeg]+[Inventory])/2
Average of beginning and ending Inventory
AccountsReceivable
CALCULATE(SUM([Ending Balance]), LASTDATE(Calendar[Date]), FILTER('AccountBalances',RELATED('Accounts'[Account Category]) = "Accounts Receivable"))
Ending A/R
AccountsReceivableBeg
CALCULATE(SUM([Beginning Balance]), FIRSTDATE(Calendar[Date]), FILTER('AccountBalances',RELATED('Accounts'[Account Category]) = "Accounts Receivable"))
Beginning A/R
AvgReceivable
([AccountsReceivableBeg]+[AccountsReceivable])/2
Average of beginning and ending A/R
NetSales
CALCULATE(SUM([Net Change]), FILTER('AccountBalances',RELATED('Accounts'[Account Category]) = "Sales" ||
    RELATED('Accounts'[Account Category]) = "Sales Returns and Discounts"))*-1
Net Sales based on selected dates
COGS
CALCULATE(SUM([Net Change]), FILTER('AccountBalances',RELATED('Accounts'[Account Category]) = "Cost of Goods Sold" ))
Cost of Goods Sold based on selected dates
TotalLiabilities
CALCULATE(SUM([Ending Balance]), LASTDATE(AccountBalances[Ending Date]), FILTER('AccountBalances', RELATED('Accounts'[Account Category]) = "Accounts Payable" ||
    RELATED('Accounts'[Account Category]) = "Dividends Payable"||
    RELATED('Accounts'[Account Category]) = "Interest Payable"||
    RELATED('Accounts'[Account Category]) = "Notes Payable"||
    RELATED('Accounts'[Account Category]) = "Other Current Liabilities"||
    RELATED('Accounts'[Account Category]) = "Taxes Payable"||
    RELATED('Accounts'[Account Category]) = "Long-Term Debt"))*-1
Ending Total Liabilities
TotalEquity
CALCULATE(SUM([Ending Balance]), LASTDATE(AccountBalances[Ending Date]), FILTER('AccountBalances', RELATED('Accounts'[Account Category]) = "Common Stock" ||
    RELATED('Accounts'[Account Category]) = "Retained Earnings"))*-1
Ending Total Stockholders’ Equity
TotalLiabilitiesBeg
CALCULATE(SUM([Beginning Balance]), FIRSTDATE(AccountBalances[Ending Date]), FILTER('AccountBalances', RELATED('Accounts'[Account Category]) = "Accounts Payable" ||
    RELATED('Accounts'[Account Category]) = "Dividends Payable"||
    RELATED('Accounts'[Account Category]) = "Interest Payable"||
    RELATED('Accounts'[Account Category]) = "Notes Payable"||
    RELATED('Accounts'[Account Category]) = "Other Current Liabilities"||
    RELATED('Accounts'[Account Category]) = "Taxes Payable"||
    RELATED('Accounts'[Account Category]) = "Long-Term Debt"))*-1
Beginning Total Liabilities
TotalEquityBeg
CALCULATE(SUM([Beginning Balance]), FIRSTDATE(AccountBalances[Ending Date]), FILTER('AccountBalances', RELATED('Accounts'[Account Category]) = "Common Stock" ||
    RELATED('Accounts'[Account Category]) = "Retained Earnings"))*-1
Beginning Total Stockholders’ Equity
NetIncome
CALCULATE(SUM([Net Change]), FILTER('AccountBalances',RELATED(Accounts[Financial Statement]) = "Profit and Loss" ))*-1
Net Income based on selected dates
InterestExpense
CALCULATE(SUM([Net Change]), FILTER('AccountBalances',RELATED(Accounts[Account Description]) = "Interest Expense" ))
Interest Expense (Note: I used the Account description for this purpose because the sample COA uses Other Expenses category for this account)
TaxExpense
CALCULATE(SUM([Net Change]), FILTER('AccountBalances',RELATED('Accounts'[Account Category]) = "Tax Expense"))
Tax Expense
GrossProfit
[NetSales]-[COGS]
Gross Profit based on selected dates
AvgTotalAssets
([TotalLiabilities]+[TotalLiabilitiesBeg]+[TotalEquity]+[TotalEquityBeg])/2
Average Total Assets for the selected dates
AvgTotalEquity
([TotalEquity]+[TotalEquityBeg])/2
Average Total Equity for the selected dates
NumberOfDays
1.0*(LASTDATE(Calendar[Date])-FIRSTDATE(Calendar[Date]))+1
Number of Days in the selected date range. This field is used in Days calculation in the ratios below.


Now that all the base fields are defined, we can create the calculated fields for financial ratios. The following tables show the financial ratios and the DAX formulas. They are divided into the following categories: Liquidity, Solvency and Profitability.
Liquidity Ratios
Calculated Field
DAX Formula
Additional information
CurrentRatio
[CurrentAssets]/[CurrentLiabilities]
Current Ratio
QuickRatio
([CurrentAssets]-[Inventory])/[CurrentLiabilities]
Quick Ratio or Acid-test Ratio
InventoryTurnover
[COGS]/[AvgInventory]
Inventory Turnover
AvgDaysInInventory
[NumberOfDays]/[InventoryTurnover]
Average Days in Inventory
ReceivableTurnover
[NetSales]/[AvgReceivable]
Receivable Turnover
AvgCollectionPeriodDays
[NumberOfDays]/[ReceivableTurnover]
Average Collection Period in Days


Solvency Ratios
Calculated Field
DAX Formula
Additional information
DebtToEquityRatio
[TotalLiabilities]/[TotalEquity]
Debt to Equity ratio
TimesInterestEarned
([NetIncome]+[InterestExpense]+[TaxExpense])/[InterestExpense]
Times Interest Earned Ratio


Profitability Ratios
Calculated Field
DAX Formula
Additional information
GrossProfitRatio
[GrossProfit]/[NetSales]
Gross Profit Ratio
ProfitMargin
[NetIncome]/[NetSales]
Profit Margin
ReturnOnAssets
[NetIncome]/[AvgTotalAssets]
Return on Assets
AssetTurnover
[NetSales]/[AvgTotalAssets]
Asset Turnover
ReturnOnEquity
[NetIncome]/[AvgTotalEquity]
Return on Equity


The following screenshot shows the results of these ratios from the sample company (TWO) data.
These ratios will be automatically recalculated when you refresh the PowerPivot data model to reflect updated GL data. You can enhance this data model by creating KPIs based on industry benchmarks and historical data for your company.